Could you give me a hint? Generating inference graphs for defeasible reasoning
Keywords: Inference Graphs, Transfer Learning, Defeasible Reasoning, Human Aiding.
Link: 2105.05418.pdf (arxiv.org)
Contribution
- Inference/Influence Graph for representing defeasible reasoning
- Transfer learning for generating influence graph
- Improvement of human performance with the aid of influence graph
Method
Inference Graph and Influence Graph
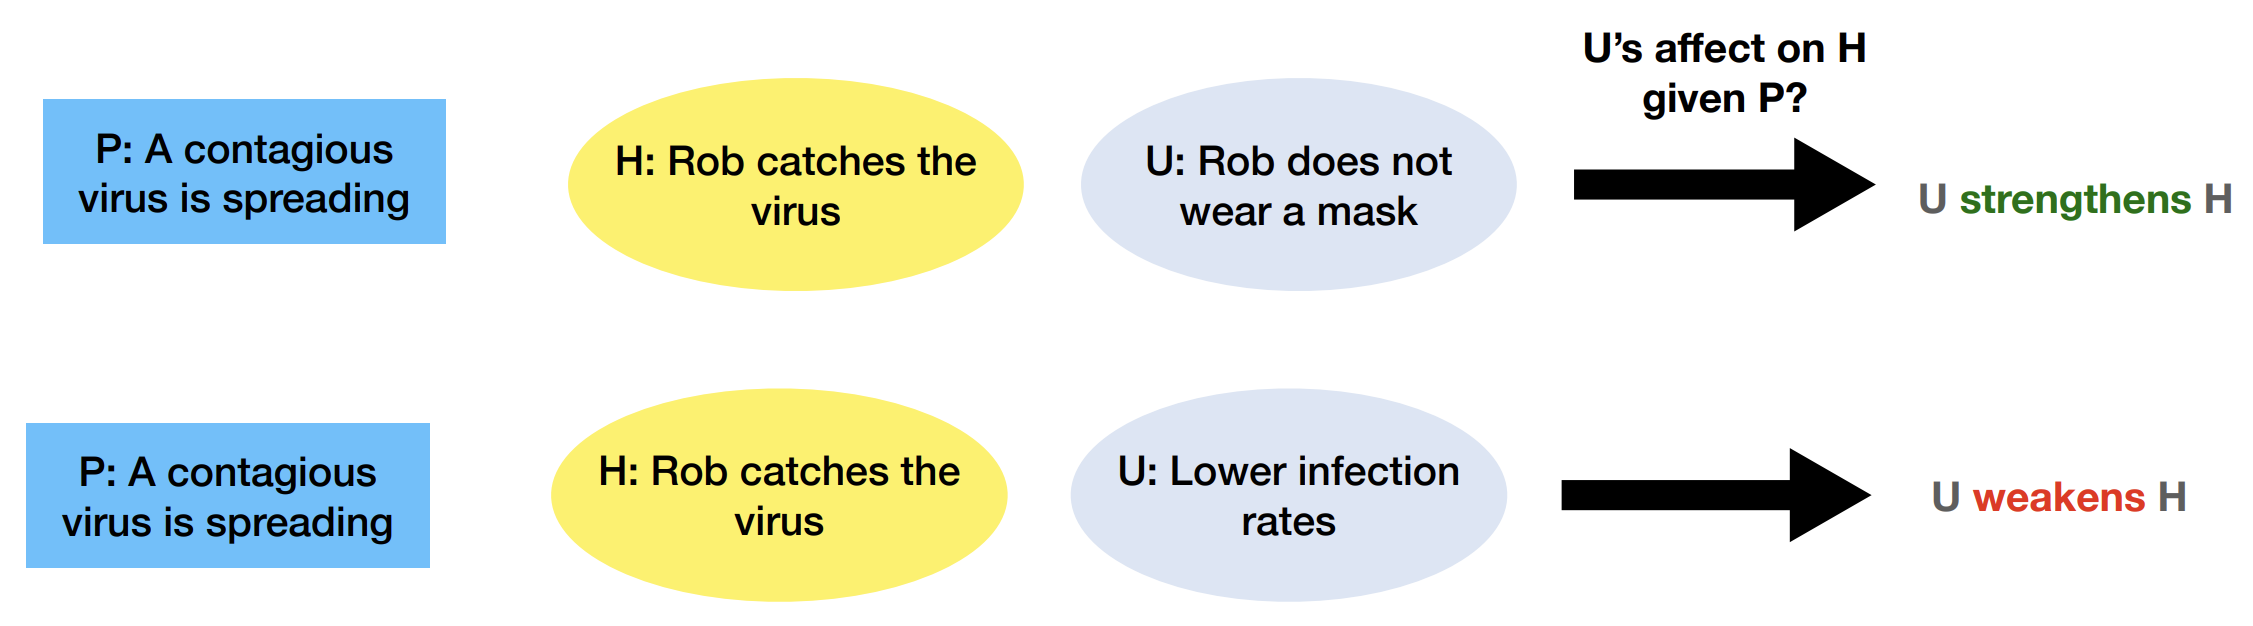
A typical causal inference is P -> H, where P is the premise and H is the hypothesis, i.e. the outcome of the premise. The arrow shows the causal relationship. Given new evidence, the hypothesis may be strengthened P|U -+-> H or weakened P|U- -x-> H. When it is weakened, this kind of reasoning is called defeasible reasoning. We can treat U as “assumptions” and U- as “defeaters”.
Then the paper adopted an inference graph (left). Added contextualizers (something related to premises) and mediators (deduction step from U to H). Actually, I think it is the dataset WIQA’s contribution (the two works share the same author Niket) instead of the paper. But anyway the paper switched its context from inference graph to influence graph (right), which is directly from WIQA.

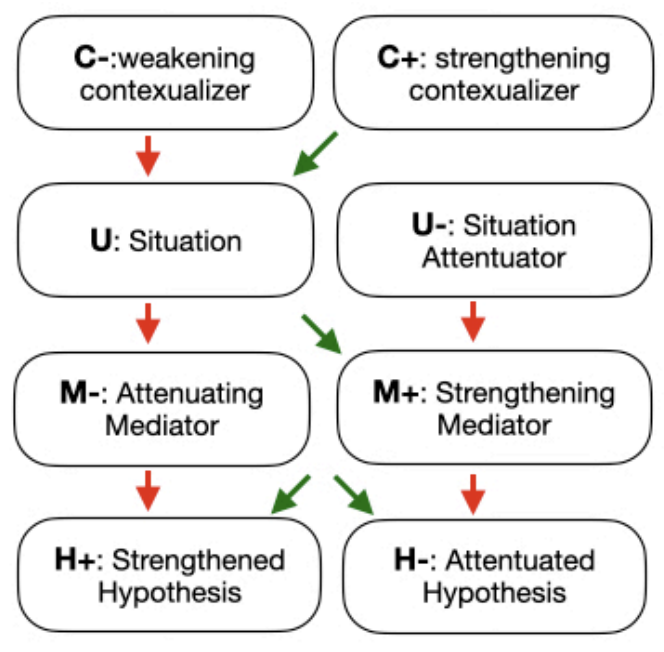
Green arrow: positive effect. Red arrow: negative effect.
Transfer Learning
Transfer learning is that you want to let your model perform a task on one dataset, but it doesn’t have any label. So you find another similar dataset with labels and adjust it to the same format as your intended task/dataset. Then you train your model on this similar dataset and then do the prediction on your target dataset.
Since the domain in the test set has changed, a good performance in the test set will indicate not only good accuracy but also excellent generalizability.
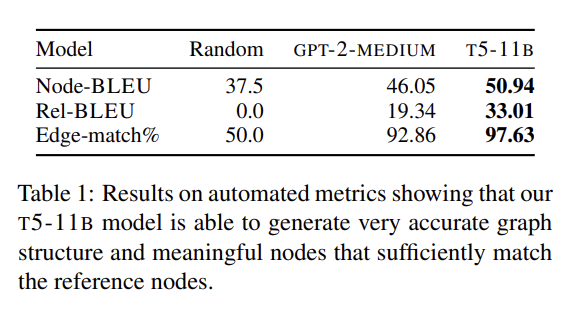
The paper aims to generate an influence graph given P, H, and U. It uses seq2seq architecture. The input of encoder is easy, which is:

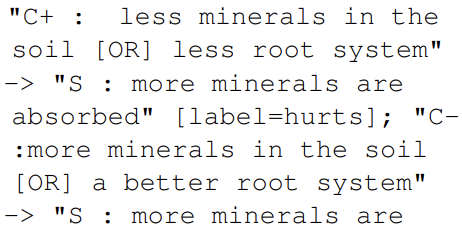
The output of decoder is the sequential representation of the influential graph. See the appendix for detail.
The authors train the models (GPT2, T5) on WIQA and generate these graphs on SNLI, SOCIAL, and ATOMIC.
They did a train-test split to WIQA and evaluate their model.
Human Improvement
Then they see if the graph helps people. They sample a challenging subset.
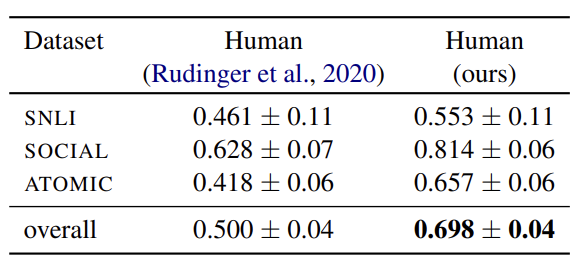
There is some improvement.